Record number of motorists dying in car accidents in New York City during the month of July
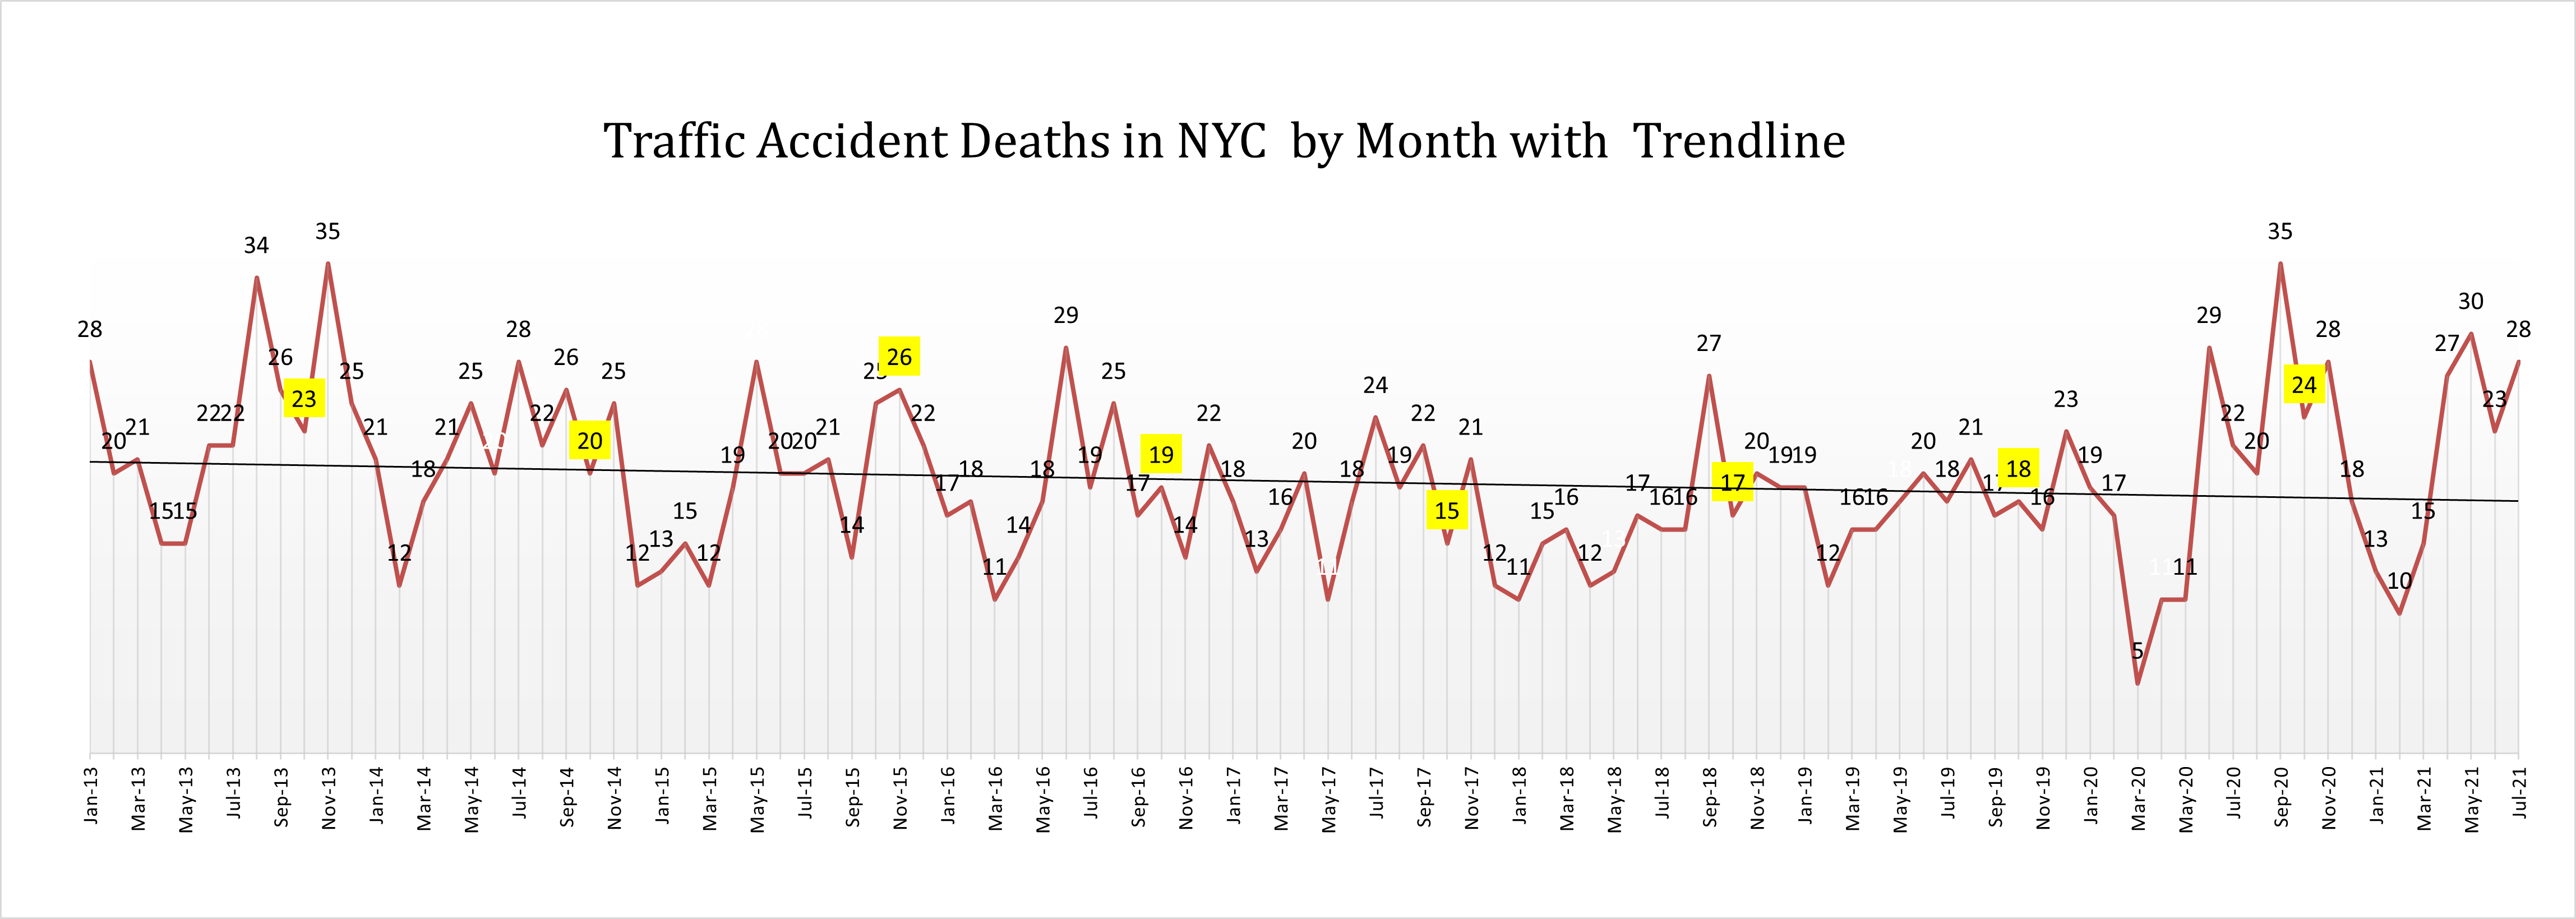
8 pedestrians, 3 cyclists, 4 motor vehicle passengers, and 13 motor vehicle drivers died in auto accidents in New York City during the month of July. Usually, monthly pedestrian deaths account for the largest share of the road fatalities in New York City but since the pandemic started, monthly motorist deaths often account for the biggest part of the motor vehicle accident fatalities in the city. As a result of this increase in motorist fatalities, since the end of the lockdown, the number of auto deaths was above 20 for 9 months out of 14. As a comparison, in 2019, it was above 20 only twice during the entire year and in 2018, only once during the entire year. Speed and recklessness have been a factor in many of these deaths as well as an increased amount of New Yorkers travelling by car instead of public transportation because of Covid19 fears.
NYC traffic accident deaths in the month of July reached their highest since July 2014 with 28 fatalities. Since June last year, road fatalities have been out of control in New York City. For the 4th consecutive month, auto accident fatalities remained above 20 and significantly above the trendline. These high numbers of fatalities had not been seen since 2013 before Vision Zero started.
Traffic accident injuries lower than before the pandemic
Motor vehicle occupants, drivers and passengers accounted for the majority of car accident injuries. In July, 2,058 motor vehicle drivers, 1,659 passengers, 460 cyclists and 536 pedestrians were injured in traffic accidents.
While monthly traffic injuries in New York have been above the trend line for the last 3 months, they do remain below 5,000. Before the pandemic, traffic injuries during the month of July had been increasing every year and were above 5,000 since July 2016.
Motorist deaths on the rise
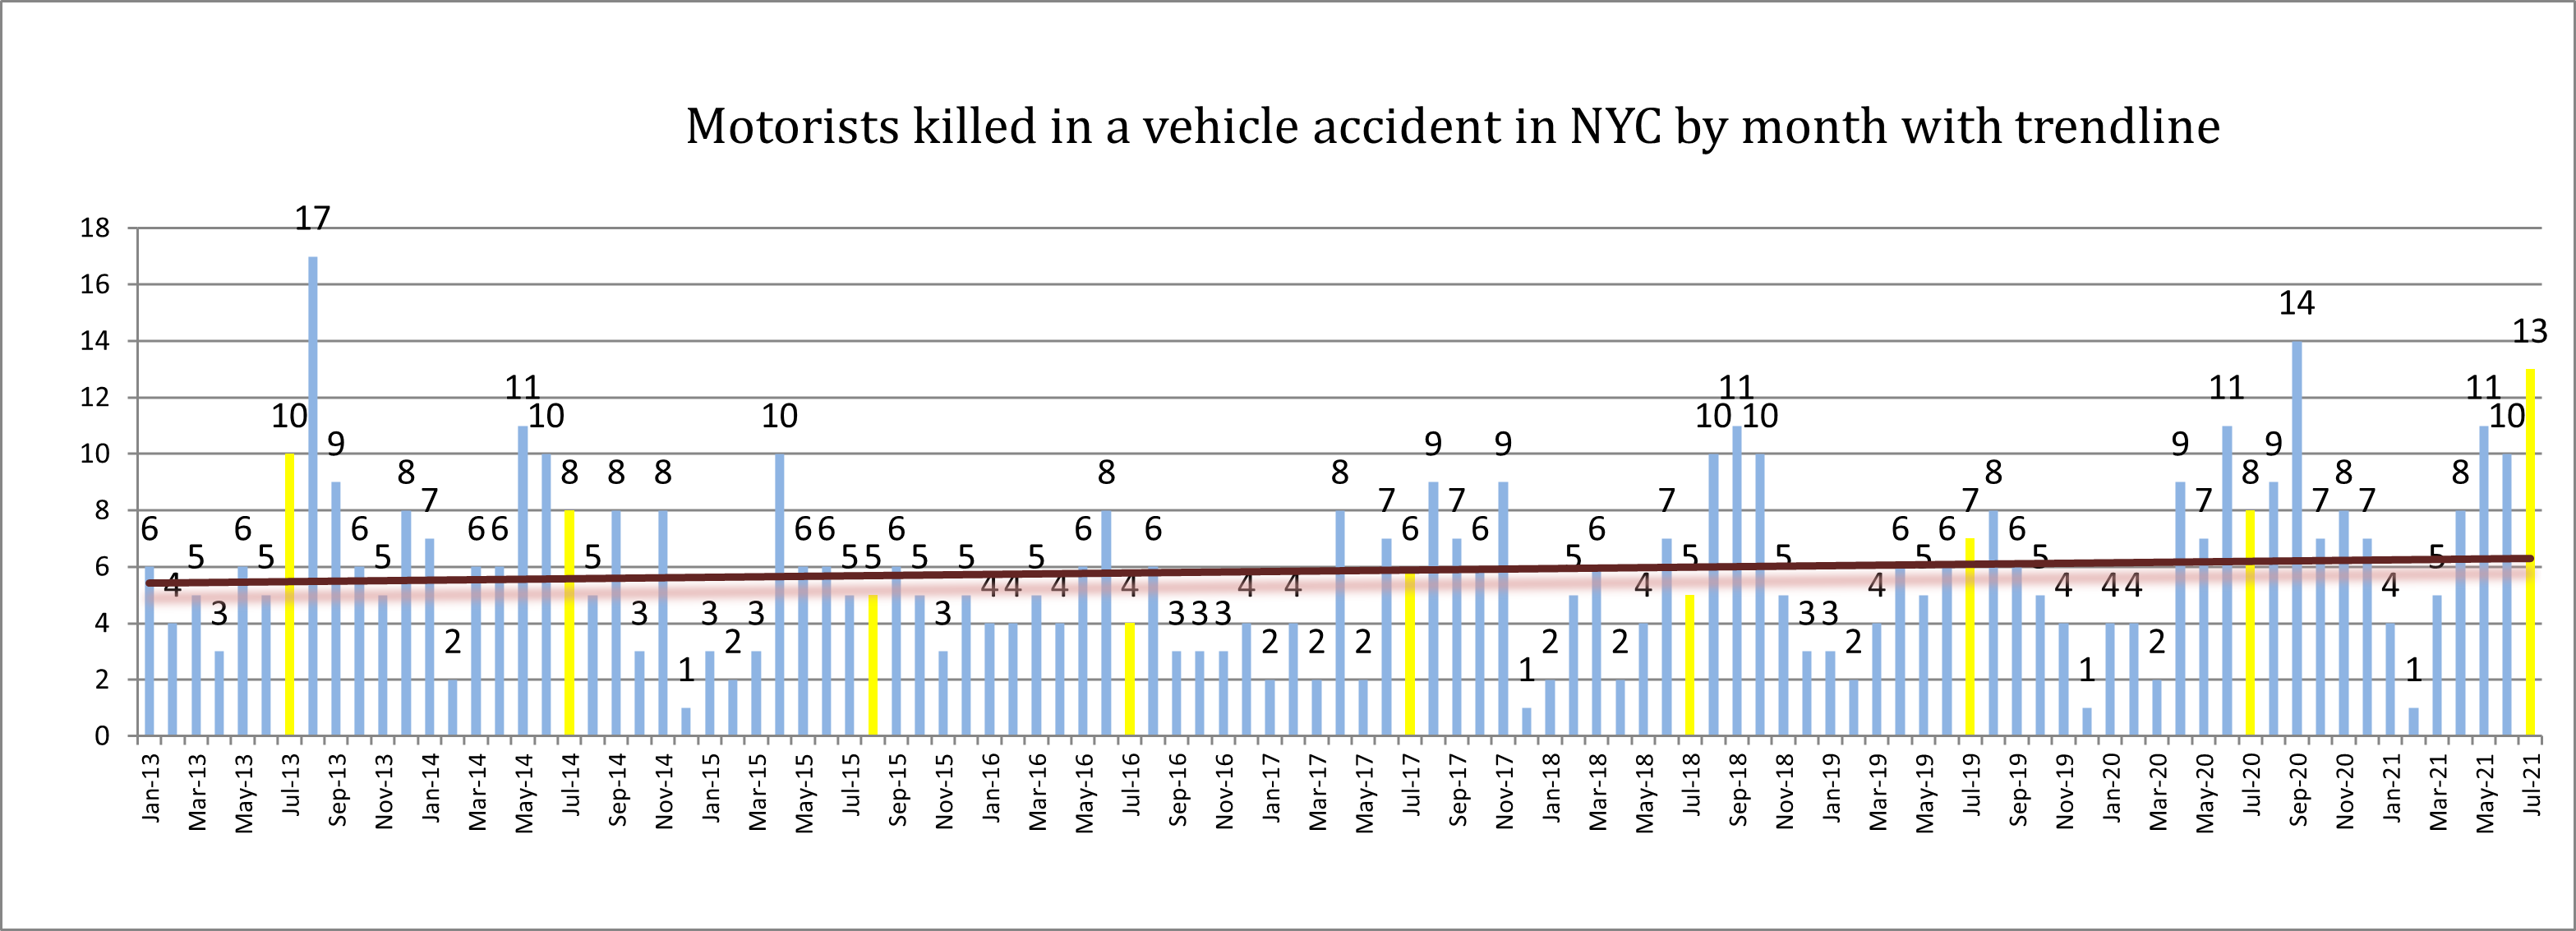
13 people who were driving a motor vehicle died behind the wheel last July compared to respectively 8, 7, 5, 6, 4, 6, 8 and 10 in July 2020, 2019, 2018, 2017, 2016, 2015, 2014 and 2013. The graph below clearly shows the gradual decrease in motorist fatalities as Vision Zero measures were getting implemented over the years and the new increase in fatalities since the pandemic started. The main factor behind the increase in fatalities last year was speeding on roads emptier than usual. However this year, roads are busy again and more people using their car because they fear catching the virus while riding public transportation might also be a factor in the increase in road fatalities.
Similar to most categories of road users, motorist injuries have been lower than usual since the pandemic started. Motorist injuries are back above 2,000 but remain lower than what they were during the 5 years preceding the pandemic.
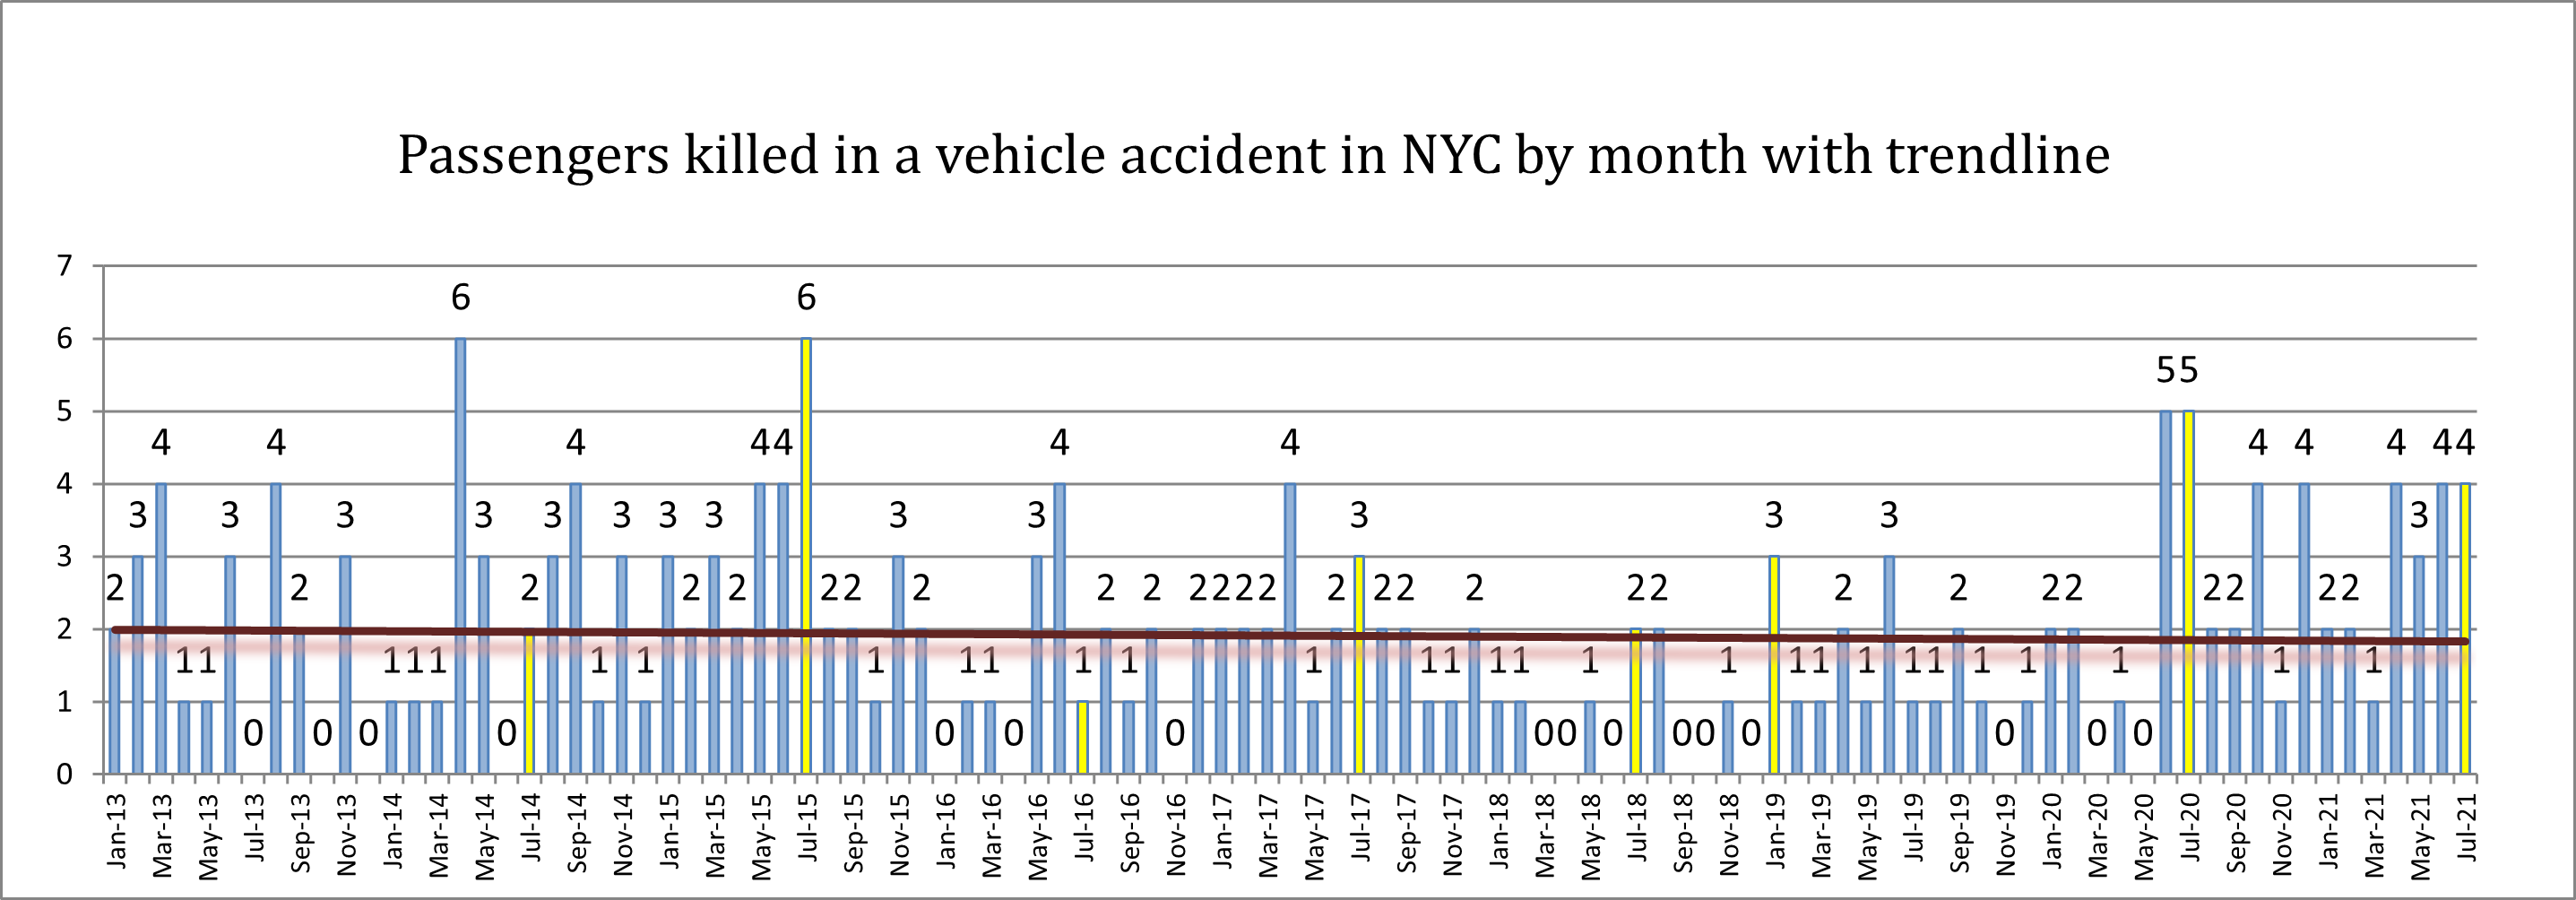
Passenger fatalities were also higher than what they used to be in pre-pandemic years. 4 passengers died in car accidents in New York City last July compared to respectively 5, 3, 2, 1 6, 2 and 0 in July 2020, 2019, 2018, 2017, 2016, 2015, 2014 and 2013.
Passenger injuries are seasonal and tend to increase during the summer months. June, July and August are usually the months during which passengers injuries increase compared to the previous months of the year. The same occurred this year again. 1,659 passengers were injured in car accidents last July compared to 1,363 the previous month. Passengers injuries for the month of July remain below what they were during the pre-pandemic years.
8 NYC pedestrians died during the month of July compared to respectively 6 the month before and 8 the same month a year earlier. The number of pedestrian fatalities in July used to be much higher before Vision Zero was implemented. 12 pedestrians died in July 2013 and another 15 died in July 2014. After that, pedestrian fatalities remained mostly below 10 during the month of July expect for 11 in July 2016 and 13 in July 2017. This year after 2 bad months in April and May during which 15 pedestrians died in each of these months, the number of pedestrian fatalities went back below 10 and remained at or below the trend line during the months of June and July 2021.
The monthly number of pedestrian injuries in New York remained below 600 for the month of July 2021. This number always used to be above 600 before the covid19 lockdown started in March 2020. Since then, it never went back above 600. It also remained below the trend line during all that time. While the city is not in lockdown since last July, pedestrian activities are not what they used to be in previous years. Many corporate companies with headquarters in the city still have their employees working at least partially from home, business travel is often replaced by zoom meetings and while tourism is making a timid come back, the Covid Delta variant has been preventing the US to fully re-open the borders. Therefore reduced pedestrian activities might explain the reduced number of injuries.
3 people died in bicycle accidents during the month of July compared to 3 the month earlier and 1 in July 2021. Since the beginning of the year 8 people died in bicycle accidents compared to 9 last year. The number of bicycle accident fatalities was low until the end of May and surged over the last two summer months. More and more people have been using a bike in New York City since the pandemic started and last year the monthly number of cyclist fatalities reached twice a record number of 6 in September and November. One of the factors in this surge of fatalities might have been that a lot of newbie cyclists were on the road. Hopefully after a year, newbies might have matured and learned the dangers of biking in the city. Another factor is that emptier roads have led to more recklessness from people driving a car such as speeding which is deadly for cyclists and pedestrians.
The idea that there are less newbies on the roads can also back the decline in bicycle accident injuries between July 2021 and July 2020. 460 people were injured in bike accidents in New York City in July 2021 compared to 677 in July 2020. The bicycle accident injuries graph below clearly shows the seasonality of bicycle accident injuries with a spike each summer. Last year that spike was the highest ever. This year, it is still higher than usual but not as high as last year which might indicate that the big rush on the bike lanes might have somewhat slowed down.
 New York Personal Injury Attorneys Blog


