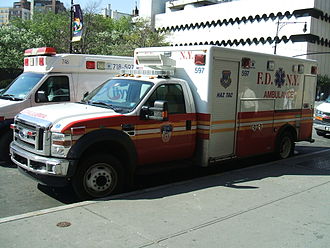
New York City employees responsible for injuring 827 people and killing 4 in vehicle crashes deemed preventable over one year
 City drivers were determined to be at fault in 3,357 motor vehicle crashes in New York City during the last fiscal year that covers the July 2018 to June 2019 period. This number is up by 10 compared to the previous year and despite a diminution of the city vehicle fleet from 31,002 to 30,755.
827 people were injured and 4 died in these accidents compared to respectively 763 and 2 during the previous fiscal year.
The city vehicle involved in the highest amount of crashes were the FDNY vehicles with 10.1 accidents per 100,000 miles traveled followed by Sanitation (7.6), Parks (4.7) and the NYPD (4.4).
The vehicles involved in the lowest amount of accidents were those of the Department of Health (1.6), Correction (2.5), Transportation (2.7), Environmental protection (2.8) and Department of Citywide administration Services (2.9).
Very often crashes by city workers are related to driving privileges. In some cases such as emergencies, these privileges are justified but they can also lead to abuses and as a result to preventable traffic accidents.
The city is also trying to prevent accidents by training its employees in defensive driving. 82% of the city employees had received this training at the end of the last fiscal year according to the Mayor’s Management Report.
Reckless city drivers cost tax payers a lot of money
Preventable traffic accidents caused by city employees cost tax payers more than $100 million yearly. According to statistics from the Comptroller’s office, in 2018, the City payed $114.2 million to settle car accident lawsuits against city drivers who injured or killed someone. Motor vehicle accidents lawsuits are the personal injury lawsuits that are costing the most to the city before police brutality and medical malpractice lawsuits. In 20018, Motor Vehicle Accidents claims represented 19% of the personal injury claim settlements paid by the city compared to 18% for police abuse, 17% for civil rights, 11% for medical malpractice, 7% for roadway, 6% for uniformed services employee, 4% for school, 4% for correction facility, 2% for parks and recreations, 2% for city property and 2% for other city related personal injury cases.
Read more in StreetBlog
Picture: courtesy of Wikipedia
 New York Personal Injury Attorneys Blog


